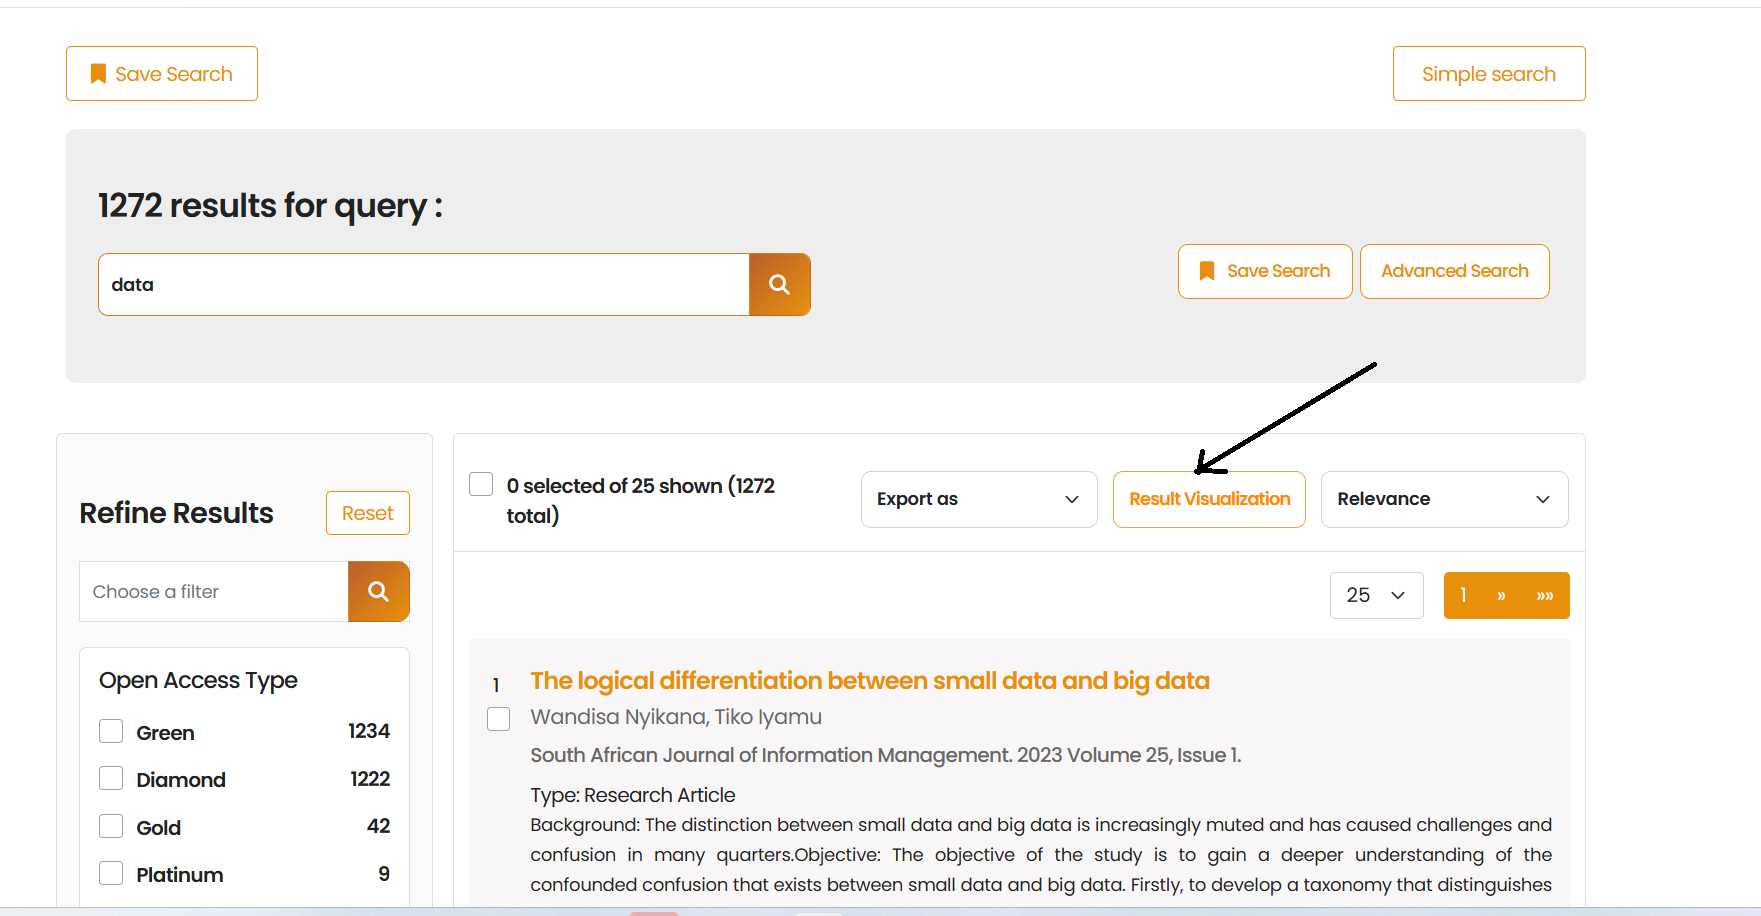
Interactive Results Visualization on AfricaRVI Website
The Results Visualization page gives you a fully interactive, drill-down experience. Here is how the new filtering works:
- Interactive Dashboard: When you click on any chart element (such as a specific year like "2025" or a specific author), it acts as an active filter for the entire dashboard.
- Real-Time Updates: As soon as you select a filter, all the other charts and the "Total Publications" count instantly recalculate and update on the same page to reflect only that filtered subset. This happens seamlessly in the background without requiring a page reload.
- View the Actual Papers: Once you've used the charts to drill down to the exact subset of data you are interested in, you can click the "Apply Filters & See Results ➔" button. This will take you back to the main search results page, displaying the actual list of publication articles that match the filters you just selected.